Conflict Mapping
Systems mapping is a key skill in conflict analysis and resolution. Unfortunately, we rarely explain why it is to our students. As a result, they often see constructing those diagrams as a waste of time. So, here is a quick introduction to why and how we use systems maps to understand the way a given conflict evolves and then how we could go about doing it.
Why Map
A map gives you a useful way of telling the story of a conflict that draws your attention to its causes and effects. When done well, conflict mapping also guides us toward things we can do to improve—if not completely solve—the conflict(s) we are interested in both in the classroom and in the field
Mapping is particularly important at a time when conflict specialists have to deal with we call wicked problems whose causes and consequences are so inextricably intertwined that they cannot be solved quickly, easily, or separately—if they can be solved at all. There are no quick fixes or certain solutions. Rather, we have to learn to see the problem we are dealing with in all of its complexity as championed the Omidyar Group, which is the for-profit and charitable arm of one of eBay’s founders.
As this video suggests, a good systems map allows you to see the following:
- By building the map and stepping back from the specifics of the conflict, you should be able to see the overall institutional, attitudinal, and behavior patterns that underlie the problem(s).
- You cannot ever hope to fully resolve the kind of conflict we cover in classes or write about in our books. You can, however, hope to make things somewhat better.
- The power to change the system undoubtedly already exist in the system itself. Your challenge is to identify and unlock them.
- You have to commit yourself to the long haul, not by adopting a strategy you will loyally follow but by understanding that you will have to adapt what you are doing as you watch change unfold in front of you.
How to Map
Conflict mapping is not a new idea. I first encountered it in books by systems engineers when I was an undergraduate. My graduate school advisor had his students make simple “box and arrow” charts to outline the arguments being made in the books and articles we read.
With the advent of relatively cheap and powerful mainframe and then personal computers in the 1980s, it became much easier to build systems maps in general and conflict maps in particular. STELLA (for Systems Thinking, Experimental Learning Laboratory with Animation) allowed people to turn my professor’s box and arrow sketches into sophisticated flow models beginning in 1985. Today, we have easier to use mapping software such as Kumu which come with a freeware version.
As the proliferation of mapping software suggests, there is no one mapping tool that everyone thinks is the best. In fact, in my own work, I find the very hands-on approach used by the Omidyar Group (which often also uses Kumu) to be the best way to start.
However you do them, maps are best “drawn” by a group of people, and the more diverse the group is and the more time it has to devote, the better the map will be. The process of doing so is really quite simple as long as you have a large stack of sticky notes, access to a white board, and someone knows how to take pictures using a smartphone.
Each person writes ideas on three stacks of sticky notes, identifying his or her gut instincts about:
- The nature of the problem
- Its causes
- Its consequences
Members of the group than put their notes on the board with the causes on the right, the nature of the problem in the middle, and consequences on the right.
Now the fun and hard work begins. Begin putting the notes into clusters of similar ideas.
Then, you will notice that some of the notes are pretty vague. In recent exercises I’ve seen, people have terms like polarization when discussing conflict in the United States. So, your challenge is to “unpack” that concept into its component parts, each of which goes on its own sticky note.
Keep adding the notes to the board and keep looking for clusters. It can take several sessions before your group hones in on a set of key clusters. When you get to that point, you still aren’t done.
Ask yourself and others to mention things that you’ve left out. Add those issues if you need to.
You still aren’t done. Start drawing arrows between the causes and effects. Talk with your teammates about what those arrows mean. As you do so, you are beginning to tell the story and create your conflict narrative.
As you do so, you will undoubtedly see two things that are true of any conflict system:
- There are some causal factors and consequences that are quite distant from the problem while others are quite close. The more distant ones are referred to as upstream causes and downstream effects respectively.
- All systems have feedback loops in which causes cause effects and vice versa. Identify what look like the key ones that are both leading the system into trouble as well as the ones that seem to be making things better.
Systems mapping was initially created by engineers who used software like STELLA to build mathematical models of complex systems and their evolution. Conflict resolution lacks the sophisticated tools that let us build those kinds of models and the algorithms that underlie them. To make matters worse, none of us have the mathematical or coding skills to build them.
In the end, building a systems map like the one I’ve included here is what I call an “informed art form.” Don’t worry if you can’t read the words on your screen. It’s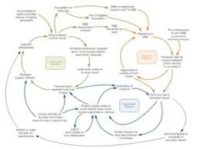 most important that you see that in a conflict map:
- Everything is connected either directly or indirectly.
- There are lots of mutually reinforcing feedback loos that appear here as ovals or circles.
We can never be sure that it is right. There is always intuition involved. But, your map should be based on the best available evidence about the conflict and its context.
That is also why conflict maps should be built by a team, because you end up with multiple perspectives on the problem even if the group only includes first year students who only have an hour or two to give to the mapping exercise.
What to do with your Map
To see that return to the four bullet points I drew from the Omidyar video. If you have done even a half decent job of building your map, it should help you because:
- Seeing the overall patterns should help you prioritize what could and should be changed.
- The map can then help you identify realistic, achievable goals that could make the system perform somewhat better. Some of those should
- You will find that there are “bright spots” in the narrative that you can build on in producing constructive and lasting change.
- If nothing else, you will see that there are no quick fixes. Instead, the minute you change one element in the system (presumably by building on a bright spot), everything else changes as a result. In short, you have to keep learning and adapt your interventions. Maybe for the rest of your lives.
The views and opinions expressed in this article are those of the author and do not necessarily reflect the official policy or position of the Alliance for Peacebuilding or its members.
Also published on Medium.